Rincón de Práctica R#
Datos Panel usando R#
Exploración inicial#
# Lectura de datos y exploración inicial de la base
options(warn=-1)
library(foreign)
Panel <- read.dta("http://dss.princeton.edu/training/Panel101.dta") # Source: http://dss.princeton.edu/training,
View(head(Panel,10))
| country | year | y | y_bin | x1 | x2 | x3 | opinion | op | |
|---|---|---|---|---|---|---|---|---|---|
| <fct> | <int> | <dbl> | <dbl> | <dbl> | <dbl> | <dbl> | <fct> | <dbl> | |
| 1 | A | 1990 | 1342787840 | 1 | 0.27790365 | -1.1079559 | 0.28255358 | Str agree | 1 |
| 2 | A | 1991 | -1899660544 | 0 | 0.32068470 | -0.9487200 | 0.49253848 | Disag | 0 |
| 3 | A | 1992 | -11234363 | 0 | 0.36346573 | -0.7894840 | 0.70252335 | Disag | 0 |
| 4 | A | 1993 | 2645775360 | 1 | 0.24614404 | -0.8855330 | -0.09439092 | Disag | 0 |
| 5 | A | 1994 | 3008334848 | 1 | 0.42462304 | -0.7297683 | 0.94613063 | Disag | 0 |
| 6 | A | 1995 | 3229574144 | 1 | 0.47721413 | -0.7232460 | 1.02968037 | Str agree | 1 |
| 7 | A | 1996 | 2756754176 | 1 | 0.49980500 | -0.7815716 | 1.09228814 | Disag | 0 |
| 8 | A | 1997 | 2771810560 | 1 | 0.05162839 | -0.7048455 | 1.41590083 | Str agree | 1 |
| 9 | A | 1998 | 3397338880 | 1 | 0.36641079 | -0.6983712 | 1.54872274 | Disag | 0 |
| 10 | A | 1999 | 39770336 | 1 | 0.39584252 | -0.6431540 | 1.79419804 | Str disag | 0 |
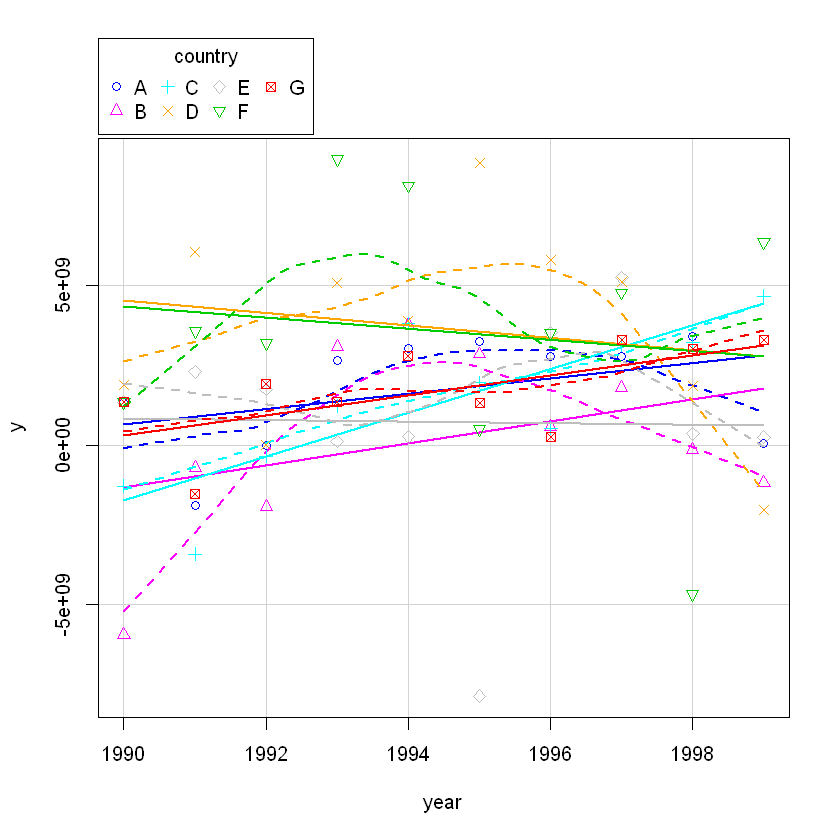
# gráficamente: diferencias a través del tiempo

library(car)
scatterplot(y~year|country, boxplots=FALSE, smooth=TRUE, reg.line=FALSE, data=Panel)
Loading required package: carData
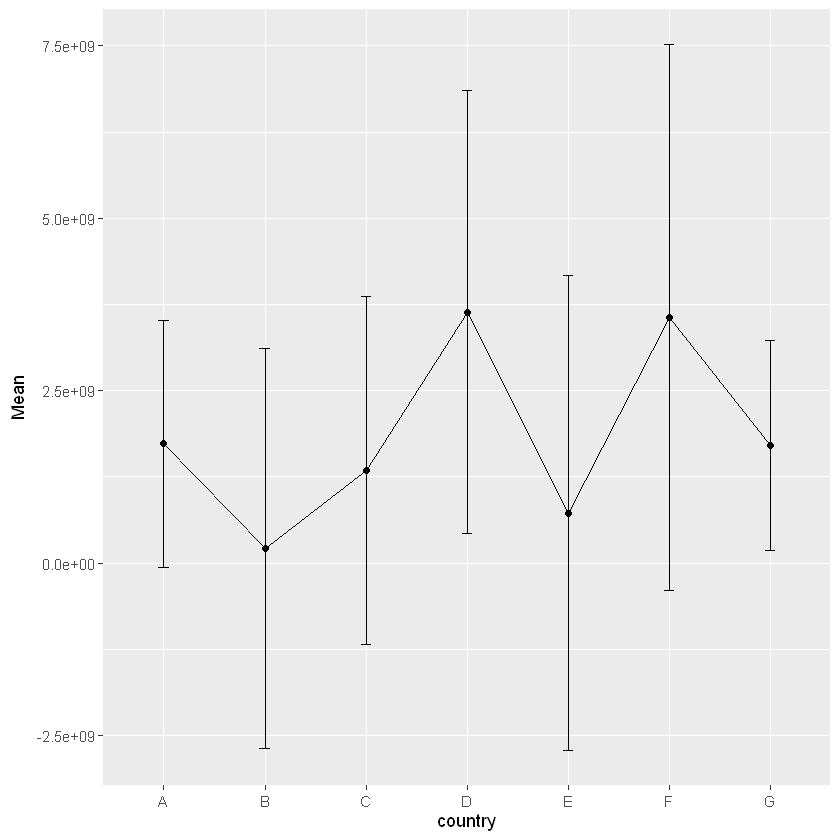
# gráficamente: diferencias entre países

library(tidyverse)
ggplot(Panel|>group_by(country)|>mutate(Mean=mean(y), Sd=sd(y)) , aes(country, Mean,group=1)) +
  geom_errorbar(aes(ymin=Mean-Sd, ymax=Mean+Sd), width=.1) +
  geom_line() +
  geom_point()
── Attaching core tidyverse packages ──────────────────────────────────────────────────────────────── tidyverse 2.0.0 ──
✔ dplyr     1.1.4     ✔ readr     2.1.5
✔ forcats   1.0.0     ✔ stringr   1.5.1
✔ ggplot2   3.5.1     ✔ tibble    3.2.1
✔ lubridate 1.9.3     ✔ tidyr     1.3.1
✔ purrr     1.0.2
── Conflicts ────────────────────────────────────────────────────────────────────────────────── tidyverse_conflicts() ──
✖ purrr::%||%()   masks base::%||%()
✖ dplyr::filter() masks stats::filter()
✖ dplyr::lag()    masks stats::lag()
✖ dplyr::recode() masks car::recode()
✖ purrr::some()   masks car::some()
ℹ Use the conflicted package (<http://conflicted.r-lib.org/>) to force all conflicts to become errors
Estimación OLS#
\[y_{it}=\beta_0 + \beta_1x_{it}+u_{it}\]
# Usando OLS notar que no es est. sig.

library(pander)
OLS <-lm(y ~ x1, data=Panel)
panderOptions('digits',4)
pander(OLS)
|            | Estimate  | Std. Error | t value | Pr(>|t|) |
|:---------------:|:---------:|:----------:|:-------:|:--------:|
| **(Intercept)** | 1.524e+09 | 621072624  |  2.454  | 0.01668  |
|     **x1**      | 4.95e+08  | 778861261  | 0.6355  |  0.5272  |

Table: Fitting linear model: y ~ x1
Estimación LSDV#
\[y_{it}=\sum_i\alpha_i d_i + \beta_1x_{it}+u_{it}\]
lo mismo que $\(y_{it}=\alpha_AD_A+\alpha_BD_B+...+\beta_1x_{it}+u_{it}\)$
# Usando LSDV notar que x1 es ahora est. sign.

FE.D <-lm(y ~ x1 + factor(country) - 1, data = Panel)
pander(coefficients(summary(FE.D)))
|                 |  Estimate  | Std. Error | t value | Pr(>|t|)  |
|:--------------------:|:----------:|:----------:|:-------:|:---------:|
|        **x1**        | 2.476e+09  | 1.107e+09  |  2.237  |  0.02889  |
| **factor(country)A** | 880542404  | 961807052  | 0.9155  |  0.3635   |
| **factor(country)B** | -1.058e+09 | 1.051e+09  | -1.006  |  0.3181   |
| **factor(country)C** | -1.723e+09 | 1.632e+09  | -1.056  |  0.2951   |
| **factor(country)D** | 3.163e+09  | 909459150  |  3.478  | 0.0009303 |
| **factor(country)E** | -602622000 | 1.064e+09  | -0.5662 |  0.5733   |
| **factor(country)F** | 2.011e+09  | 1.123e+09  |  1.791  |  0.07821  |
| **factor(country)G** | -984717493 | 1.493e+09  | -0.6597 |  0.5119   |
Estimación FE#
Within Estimator: regresión de \((y_{it}-\bar{y}_i)\) sobre \((x_{it}-\bar{x}_i)\)
# USando FE el resultado es el mismo que LSDV

library(plm)
FE <- plm(y ~ x1, data=Panel, index=c("country", "year"), model="within")
pander(coefficients(summary(FE)))
Attaching package: 'plm'
The following objects are masked from 'package:dplyr':

    between, lag, lead
|   | Estimate  | Std. Error | t-value | Pr(>|t|) |
|:------:|:---------:|:----------:|:-------:|:--------:|
| **x1** | 2.476e+09 | 1.107e+09  |  2.237  | 0.02889  |